

ChatGPT's coding accuracy in Python, R, and Stata
A comparison across several tasks in causal inference

ChatGPT can code fairly well in Python. How about R and Stata?
I found one study in the journal “Health Economics Review” that compared these 3 languages across several tasks in causal inference. The article is called “Can AI write your code? A case study of Chatgpt’s statistical coding capabilities for quantitative research” by Winberg et al. Here is its methodology:
This study evaluates ChatGPT4.0 Pro’s performance in coding Difference-in-Differences (Diff-in-Diff ), Inverse Probability Treatment Weighting (IPTW), and Regression Discontinuity (RD) using problem sets and reference code from “Causal Inference: The Mixtape”. The evaluation was conducted in Python, Stata, and R. Researchers provided structured prompts and feedback, and a fourth researcher replicated all tasks to assess consistency. Primary outcomes included accuracy, efficiency, error output, editing needs, and inter-user consistency.
Here is a table that summarizes the results.
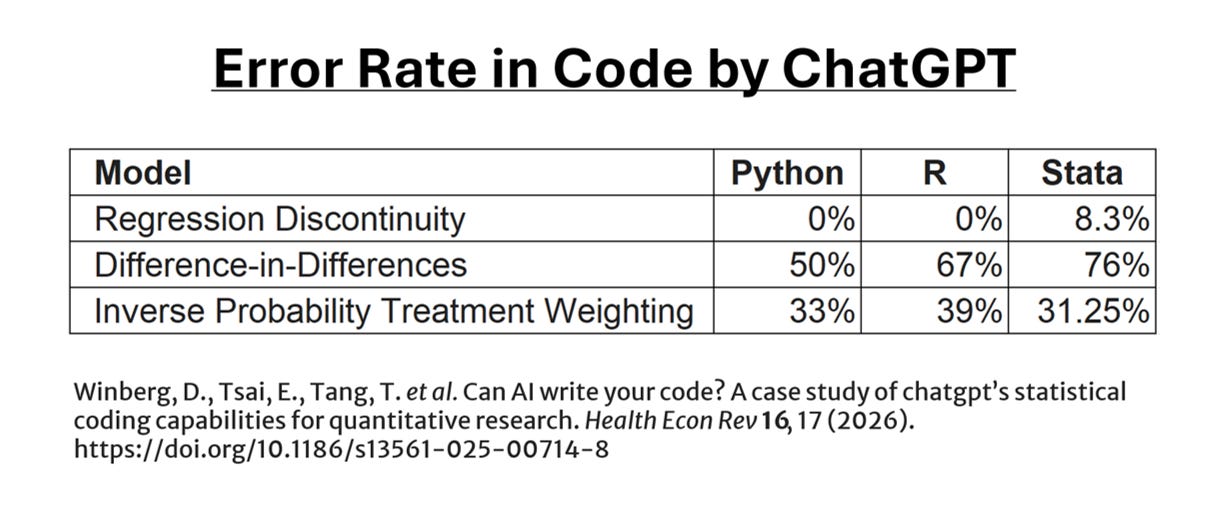
As the original table elaborates, these figures are the “proportion1 of prompts that resulted in code execution errors (number of error outputs/total prompts)”. There is a lot more detail in the article and the table, and I encourage you to read them in their entirety.
This study was published on 2026-01-22, and it used ChatGPT Pro 4.0 to generate its code. The current version of ChatGPT Pro is 5.5, so it is possible that this newest version has improved at these tasks over the past three months.
Given that Python is more popular than R or Stata, there are more examples of Python code on the Internet for large-language models (LLMs) to use as training data. Thus, it is reasonable to presume that LLMs like ChatGPT code better in Python than R or Stata. I cannot find a large-scale study to compare Python to these other languages, so this is an area for further investigation.
I currently program in Python, so I am not intimately aware of R’s latest developments. I am grateful to an anonymous biostatistician who codes in R and brought this issue to my attention.
Strictly speaking, the table is showing percentages, not proportions.