

Obtaining a frequency table with Pandas in Python
Using the value_counts() function - including what to do about missing values

When performing exploratory data analysis of a categorical variable, I like to get a list of the possible values and their respective frequencies (a.k.a. frequency table). With the Pandas package in Python, I can do so by applying the value_counts() function to a series or the column of a dataframe.
Here is an example involving the “Iris” dataset. You can execute this code in Google Colab, where the packages are already installed.
import seaborn as sb
import pandas as pd
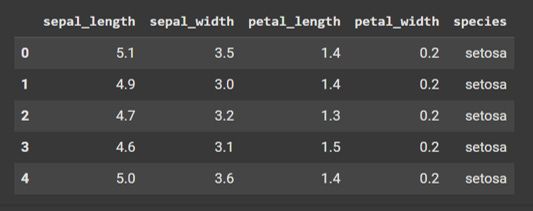
iris = sb.load_dataset('iris')Here is what this dataset looks like.
Here is the code to display the frequency table.
display(iris['species'].value_counts())Here is the output.

What if there are missing values in your dataset? I will create a fictitious dataset and illustrate what to do. The following code creates a dataset that has 10 rows.
5 have the value “red”
2 have the value “blue”
3 have missing values
import pandas as pd
import numpy as np
data = {'color': ['red'] * 5 + ['blue'] * 2 + [np.nan] * 3}
df = pd.DataFrame(data)
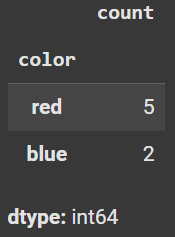
display(df.value_counts())Here is the output from value_counts(). Notice that the missing values do NOT appear in the frequency table; by default, this function excludes missing values.
To ensure that the missing values appear in the frequency table, you need to add the option “dropna=False” within the value_counts() function.

You may wish to include or exclude missing values in your frequency table; this depends on the practical question that you are trying to answer. Choose accordingly, and apply the correct code to obtain your desired output.
