


A hypothesis test can be very confusing - especially to a newcomer in statistics. I recently wrote about the 4 basic elements of any hypothesis test to make this easier to understand. Let’s apply them to an example in the intersection of retail, grocery, and consumer packaged goods (CPG); this is where I currently work as a statistician.
Suppose that a retailer wants to compare an old display (which I denote as “x”) and a new display (which I denote as “y”) for selling its cereal. It shows both displays at 100 stores, and it sells the brand of cereal boxes with different barcodes to track which display each box came from.
Which display sells more cereal: the old display or the new display?
If there is a difference, is it statistically significant1?
To answer this question, let’s use an independent, two-sample t-test. I will apply the 4 basic elements of a hypothesis test to our example.
1. What is the null hypothesis, H₀?
There is no difference in the sales between the old display and the new display.
2. What is the alternative hypothesis, Hₐ?
There is a difference in the sales between the old display and the new display.
3. What is the test statistic?
Let’s use an independent two-sided Welch's t-test, because it can account for the possibility that the variances in the sales are different between the old display and the new display.
Here is the test statistic.
The distribution of this test statistic depends on the degrees of freedom, which has the following approximation.
4. What is the rejection rule?
Let’s use a significance level (α) of 5%. Thus, if the P-value is less than 0.05, I will reject the null hypothesis.
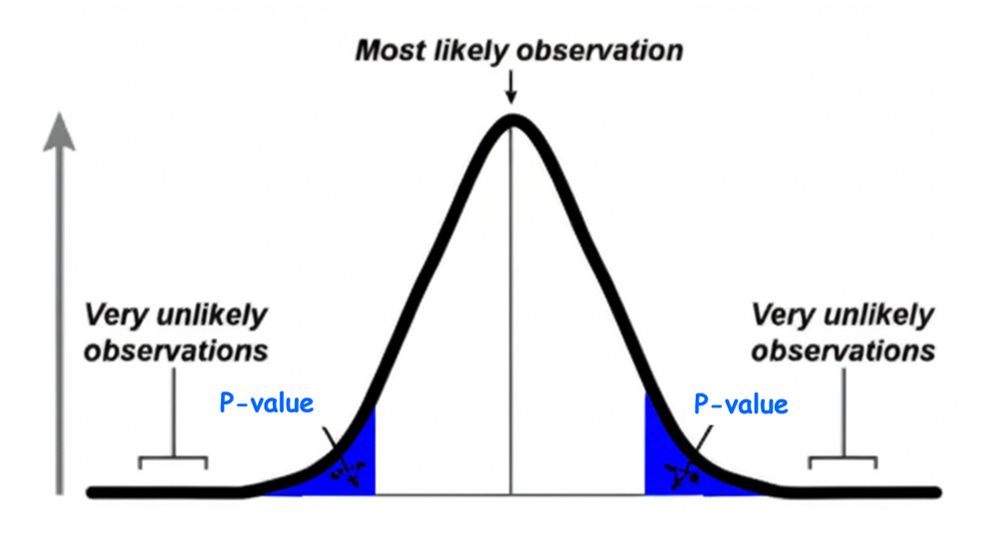
The P-value is a tricky concept to understand, let alone explain to a non-technical audience. I will devote several articles to this topic in the future; please stay tuned.
Astute readers will notice that I have written nothing about whether the new display is actually causing any change in sales; this is because I cannot establish causation in my example. For simplicity, I did not discuss other variables that may have contributed to the sales or affected the two displays; these variables are called confounding variables (or confounders). To establish causation, I must control for the confounders; this is another topic in the realms of experimental design and causal inference, and I will consider writing about them in the future.
Statistical significance is different from practical significance. A statistically significant difference may be too small to matter for the relevant business problem. This is why an effect size with a 95% confidence interval is more informative than a simple P-value. I will elaborate on this issue in a future article.