

Cross-tabulating Pandas dataframes in Python
An example using the the crosstab() function

There is a fast and under-rated way to reveal insights about your data - and it doesn’t require anything fancy like machine learning or artificial intelligence.
Cross-tabulation is a statistical method in the analysis of 2 or more categorical variables. It arranges the data into a rectangular array, with rows and columns representing the categories of each variable.
I will illustrate how to do this with the “tips” dataset, which you can load from the Seaborn package in Python. A waiter collected this information from each table that he served while working at a restaurant over several months. It contains the following variables.
tip in dollars
bill in dollars
sex of the bill payer
whether there were smokers in the party
day of the week
time of day
size of the party
You can view the data dictionary here.
For ease and simplicity, I executed this Python code in Google Colab.
import pandas as pd
import seaborn as sb
tips = sb.load_dataset('tips')
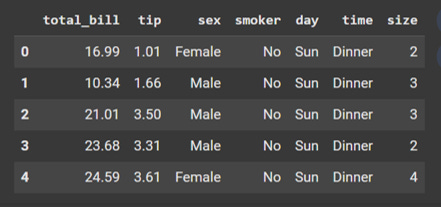
display(tips.head())Here is what the dataset looks like.
When I look at this dataset, one question comes to my mind: What is the gender split for lunch and dinner? I can obtain use the crosstab() function in the Pandas package to answer this question. Here is the code that I used:
display(
    pd.crosstab(tips['sex'], tips['time'],
                rownames=['Gender of Bill Payer'],
                colnames=['']
                )
    )
Here is the resulting table.
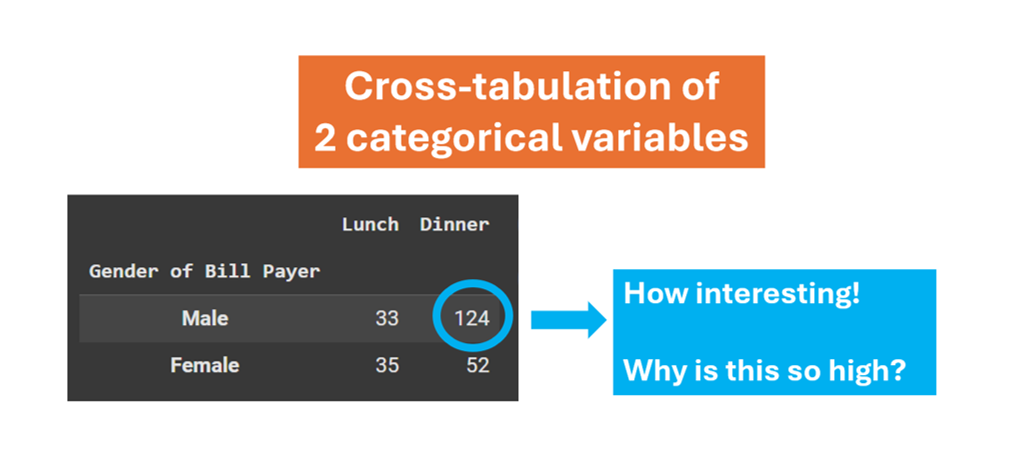
How interesting!
At lunch, the bill payers are roughly equal between males and females.
However, males far outnumber females at dinner.
Why is that? How does this relate to the total bill and the tip amount - if at all? This one insight opens several interesting questions, all of which may warrant further exploration. This is what exploratory data analysis can do.
As you can see in the above table, each cell shows the frequency of observations sharing specific characteristics across the 2 variables. (It is also possible to display the percentages in each cell - but you must decide whether you want row percentages, column percentages, or cell percentages. I will discuss these variations in a later article.)
I previously wrote about showing the frequency table of one categorical variable using the “value_counts()” function in Pandas. You can view cross-tabulation as an extension of that concept to 2 or more dimensions. (By far, the most common cross-tabulation involves 2 dimensions.)
Cross-tabulation is an easy but effective way to assess the relationship between categorical variables. It doesn’t involve any fancy mathematics or advanced software, but it often reveals valuable insights. I encourage you to use it in your exploratory data analysis.